
AI reshuffles the market: opportunity or nightmare for stock pickers?

.jpg)
- The 2026 rally has spread well beyond the Mag 7, with small-caps up over 16% and the equal-weighted S&P 500 nearly matching its cap-weighted sibling on the back of 38% expected earnings growth across the broader index.
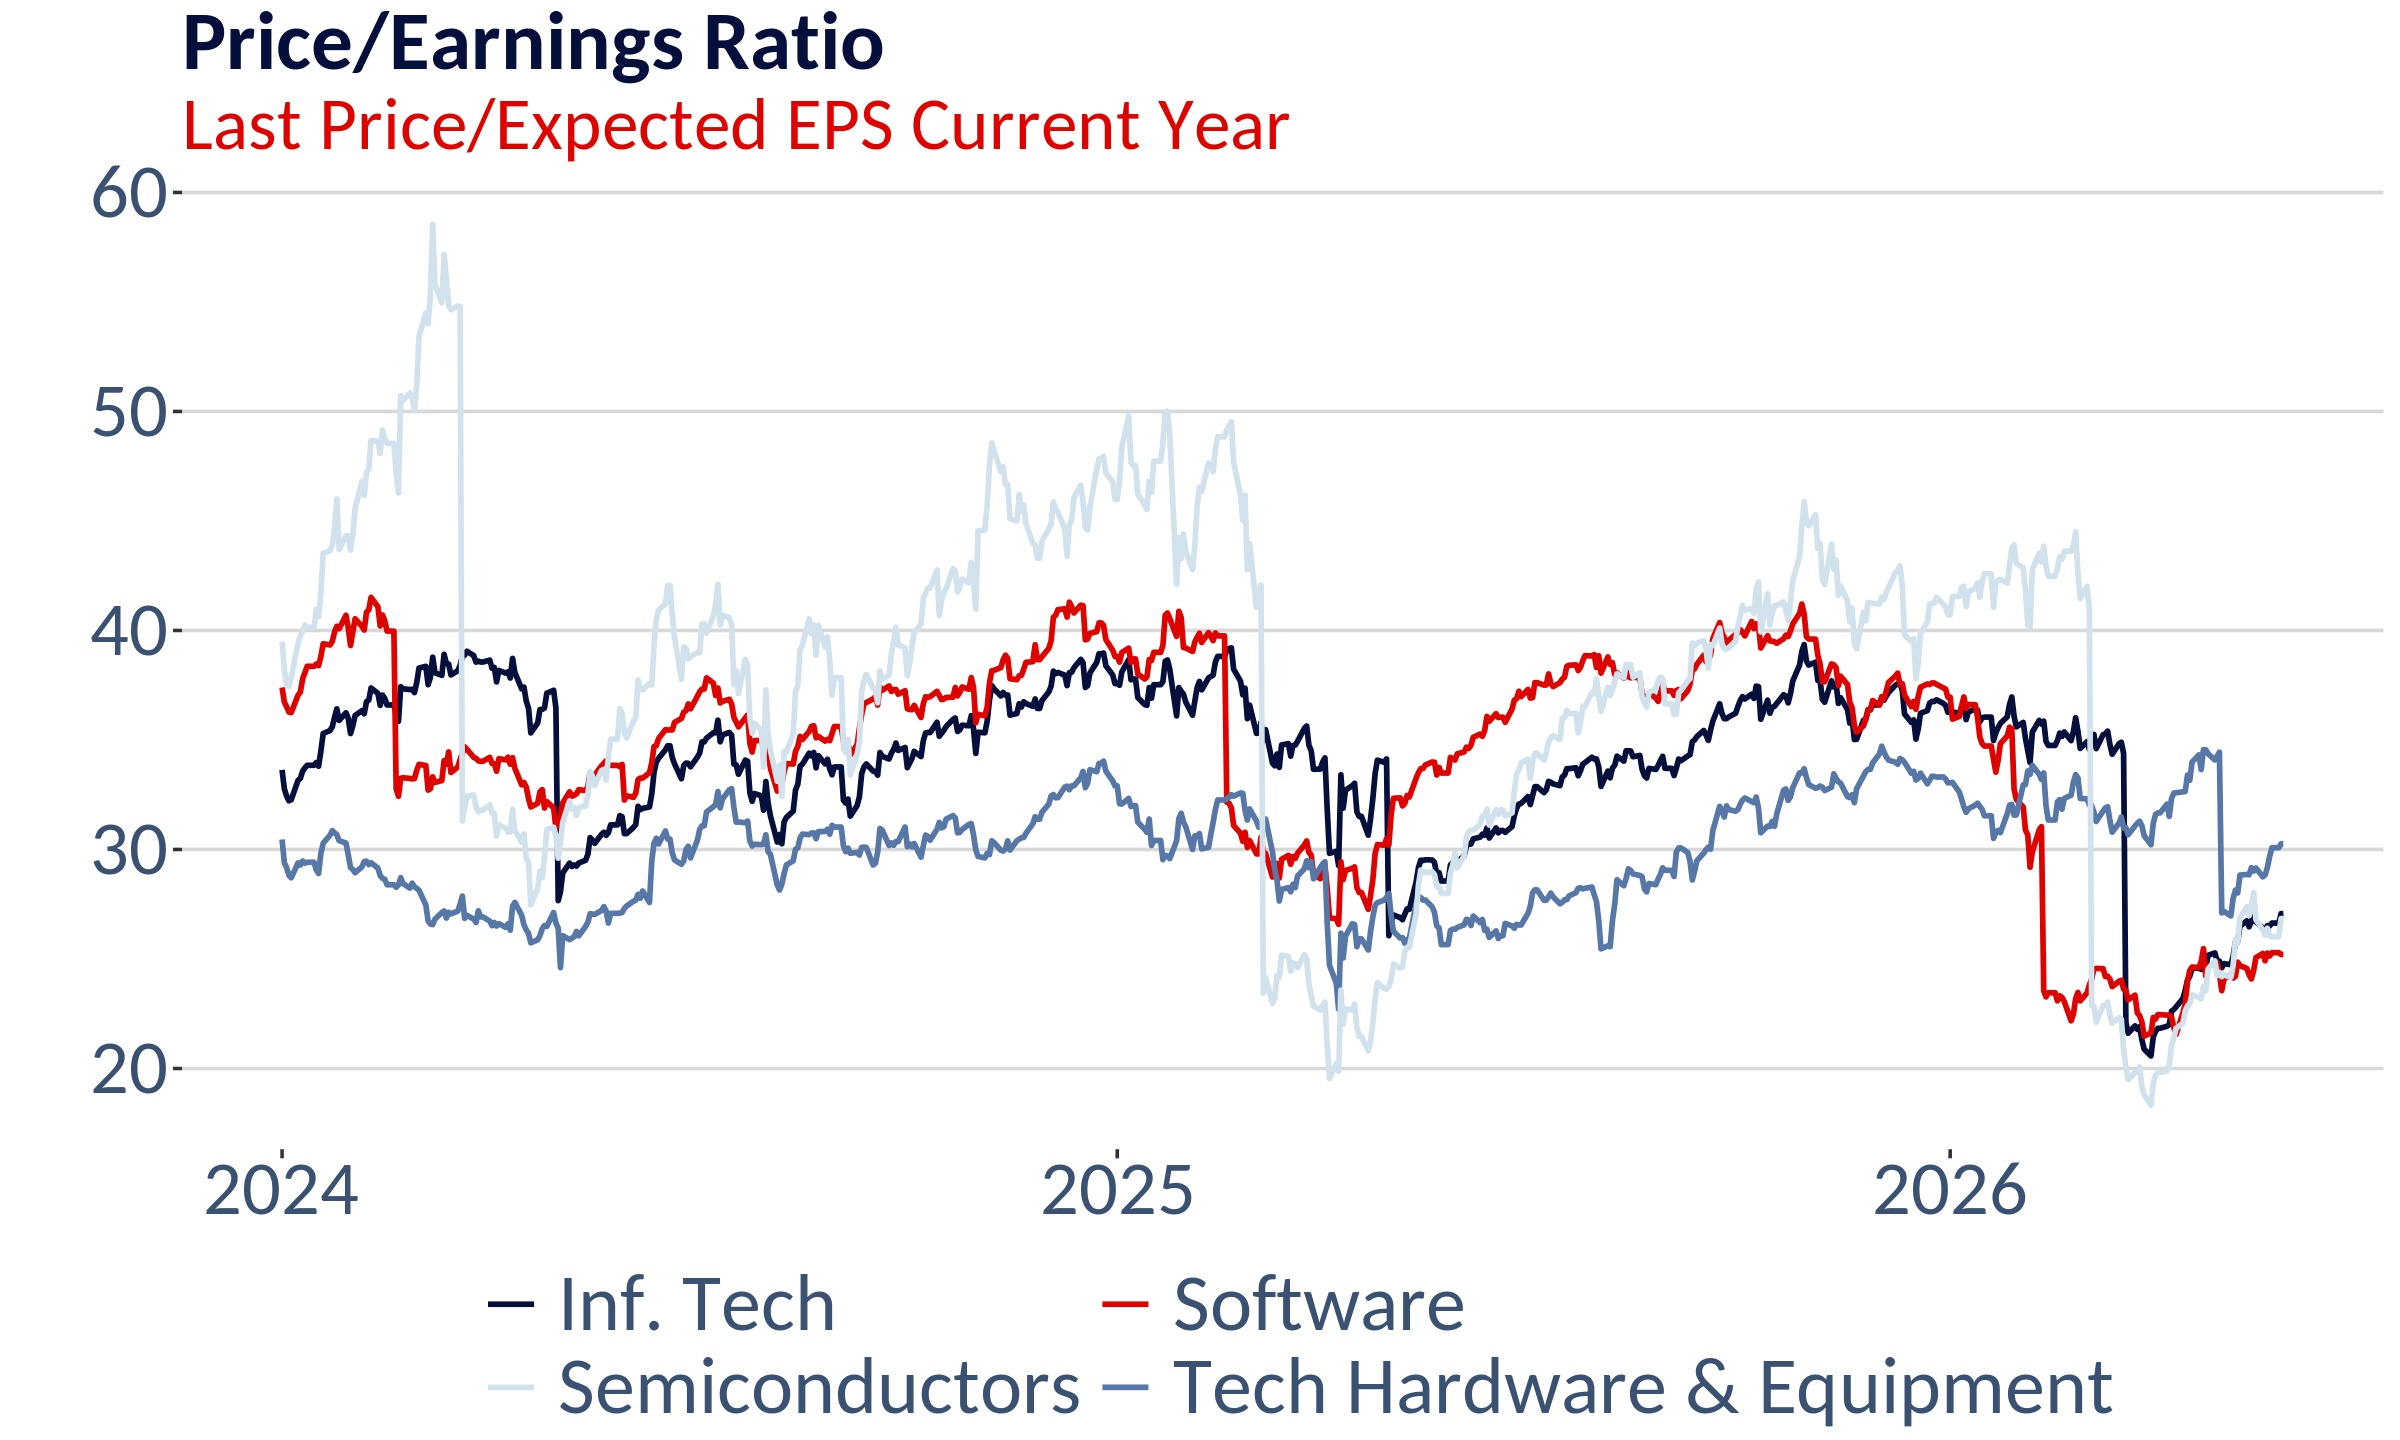
- Once a stock pickers staple for its stable, recurring revenues, the software sector has shed nearly 30% of its valuation multiples since 2025 as investors begin pricing in AI-driven commoditisation of high-margin business models.
- Rallies in long-unloved semiconductor and tech hardware names like Micron, Intel and Cisco have pushed Value and Momentum into a rare convergence, with both indices now holding over 43% in semiconductors and technology hardware names.
- Unlike the dot-com run-up, when tech multiples ballooned from 25x to 70x, today's bull market has been driven primarily by profit growth, leaving valuations likely to deflate quickly if names like Nvidia deliver on consensus EPS expectations.
The first half of 2026 has brought about a massive upheaval in the software industry, coupled with a renewed boom among AI winners and, somewhat less expectedly, in the oil and gas sector. At the same time, the recent upturn has been relatively broad-based, with US small-caps even outperforming the S&P 500 of late. Despite geopolitical turmoil, the rally has been underpinned more by strong upward revisions to earnings forecasts than by an expansion in price-to-earnings ratios, bringing questions about the sustainability of operational momentum – rather than irrational euphoria – into sharp focus. For individual stock investors who have for years lamented the limited investment opportunities in a market dominated by a handful of big-tech names, this environment should be a welcome change.
A surprisingly broad bull market
Morningstar, the financial data and fund rating provider, regularly publishes figures on the relative performance of active investment managers compared to their benchmark. For portfolio managers, particularly those engaged in single stock selection, these statistics have never been particularly motivating, with results repeatedly showing that the number of funds that succeed at outperforming indices such as the S&P 500 over an extended period is negligible. According to a study published in February this year, only 11% of active equity funds beat their benchmarks over the past 10 years. More importantly, the percentage of outperforming managers has been declining over time, hovering at historically low values of 25% and 35% since 2022 across all categories.

Increased market concentration, particularly in US equities, where a relatively small number of companies command historically elevated index weights and have, at the same time, outperformed the broader stock market fairly consistently, is often blamed for the predicament. Indeed, the outperformance of the market-cap-weighted S&P 500 over its equal-weighted sibling since 2022, while insignificant over the preceding decade, is remarkable and has consistently prompted concerns over the effectiveness of diversification and the broader market's vulnerability to shocks affecting the largest businesses.
Interestingly and potentially good news for active stock pickers, this year has so far defied the popular narrative of a handful of stocks carrying an increasingly brittle stock market to new highs. In fact, since the beginning of the year, the S&P 500 outperformed the equal-weighted index only slightly (+9.7% vs +8.4%) while the Russell 2000, which reflects the performance of US small-caps, returned more than 16%, thus marking an unexpected comeback of the second line of public companies.
However, as usual, the really interesting developments took place under the bonnet. Above all, somewhat counterintuitively, the US stock market simultaneously saw momentum strategies outperform significantly, as demonstrated by the 22% return on the MSCI USA Momentum ETF and sharp reversals, such as the slump in software shares.
In other words, the recent bull market has been much more broad-based than last year's rally, which is not too surprising given extremely strong earnings revisions across the board. On aggregate, the S&P 500 equal-weight index is now expected to post a whopping 38% increase in earnings in 2026, higher than the market-cap-weighted index's 30% and the Russell's still respectable 17%.
For the coming year, on the other hand, the consensus now expects the highest earnings growth for the small-cap index (20%), thus explaining some of the rally there, followed by the market-cap-weighted index (+16%) and a still pretty solid +13% for the equal-weighted index. Consequently, based on forward price-to-earnings ratios, the US market does actually appear a bit cheaper than at the start of the year, though our forward-looking capital market estimates using a reverse DCF model suggest that the expected medium-term returns on US equities have fallen by around 50 basis points.
No market leadership is forever
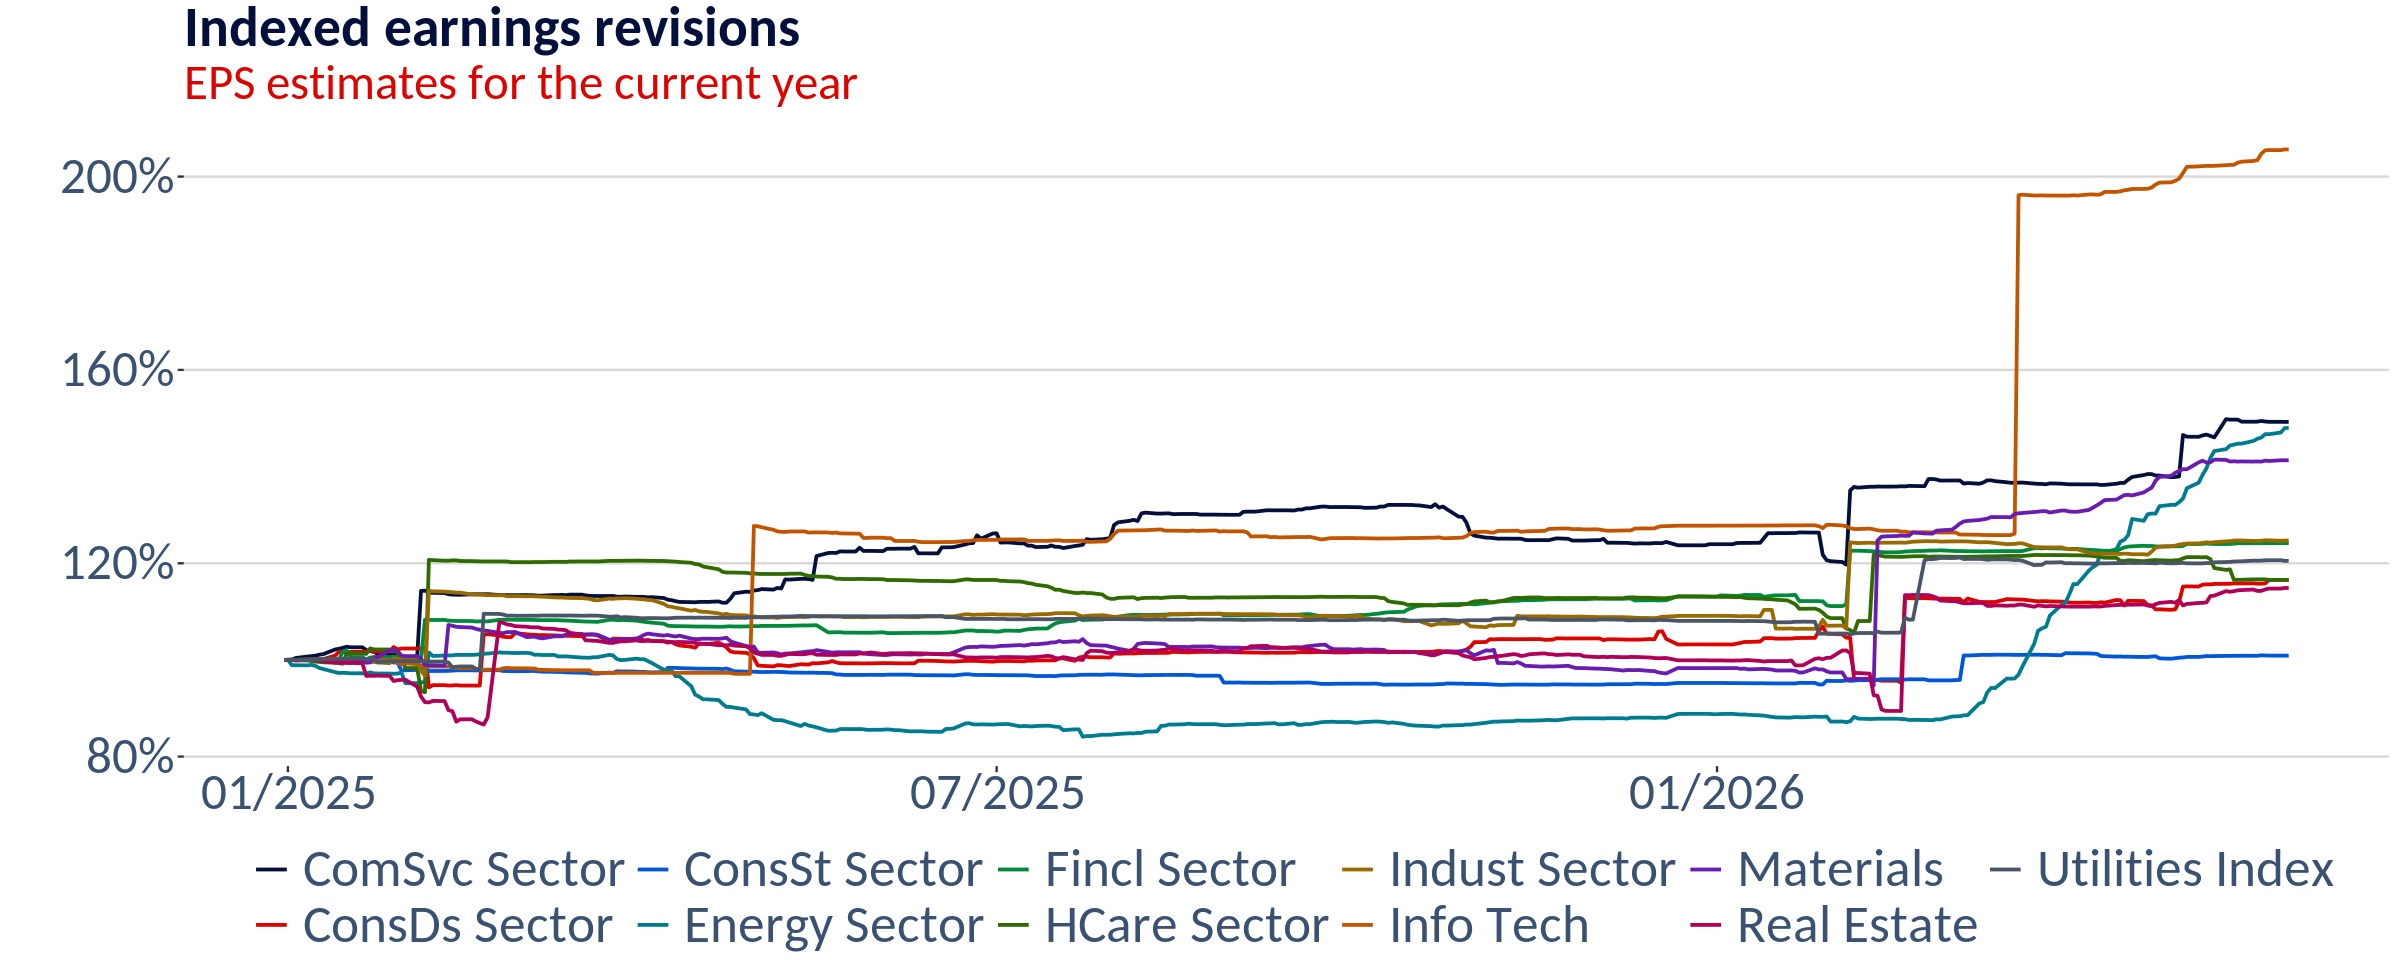
Looking at returns since the start of the year by sector, technology, communication services and energy were clearly the key drivers of performance, having benefited from the unique combination of the expansion of AI capabilities and a jump in oil prices. Earnings upgrades have backed up the trend with EPS revisions moving higher in the technology and communication services sector and surging in the energy industry. The latter marks a stunning reversal after the sector posted the weakest EPS momentum in 2025. A similarly dramatic reversal has been taking place under the hood in the technology industry, where software companies — long-term darlings of investors due to their stable growth and high share of recurring, non-cyclical revenue generation — have been badly bitten by the release of Claude Code. Interestingly, the fundamentals of the software industry, on aggregate, still look stable, but investors have started to treat them as a look in the rear-view mirror, focusing on the outlook in which once-high-margin software may increasingly become commoditised.
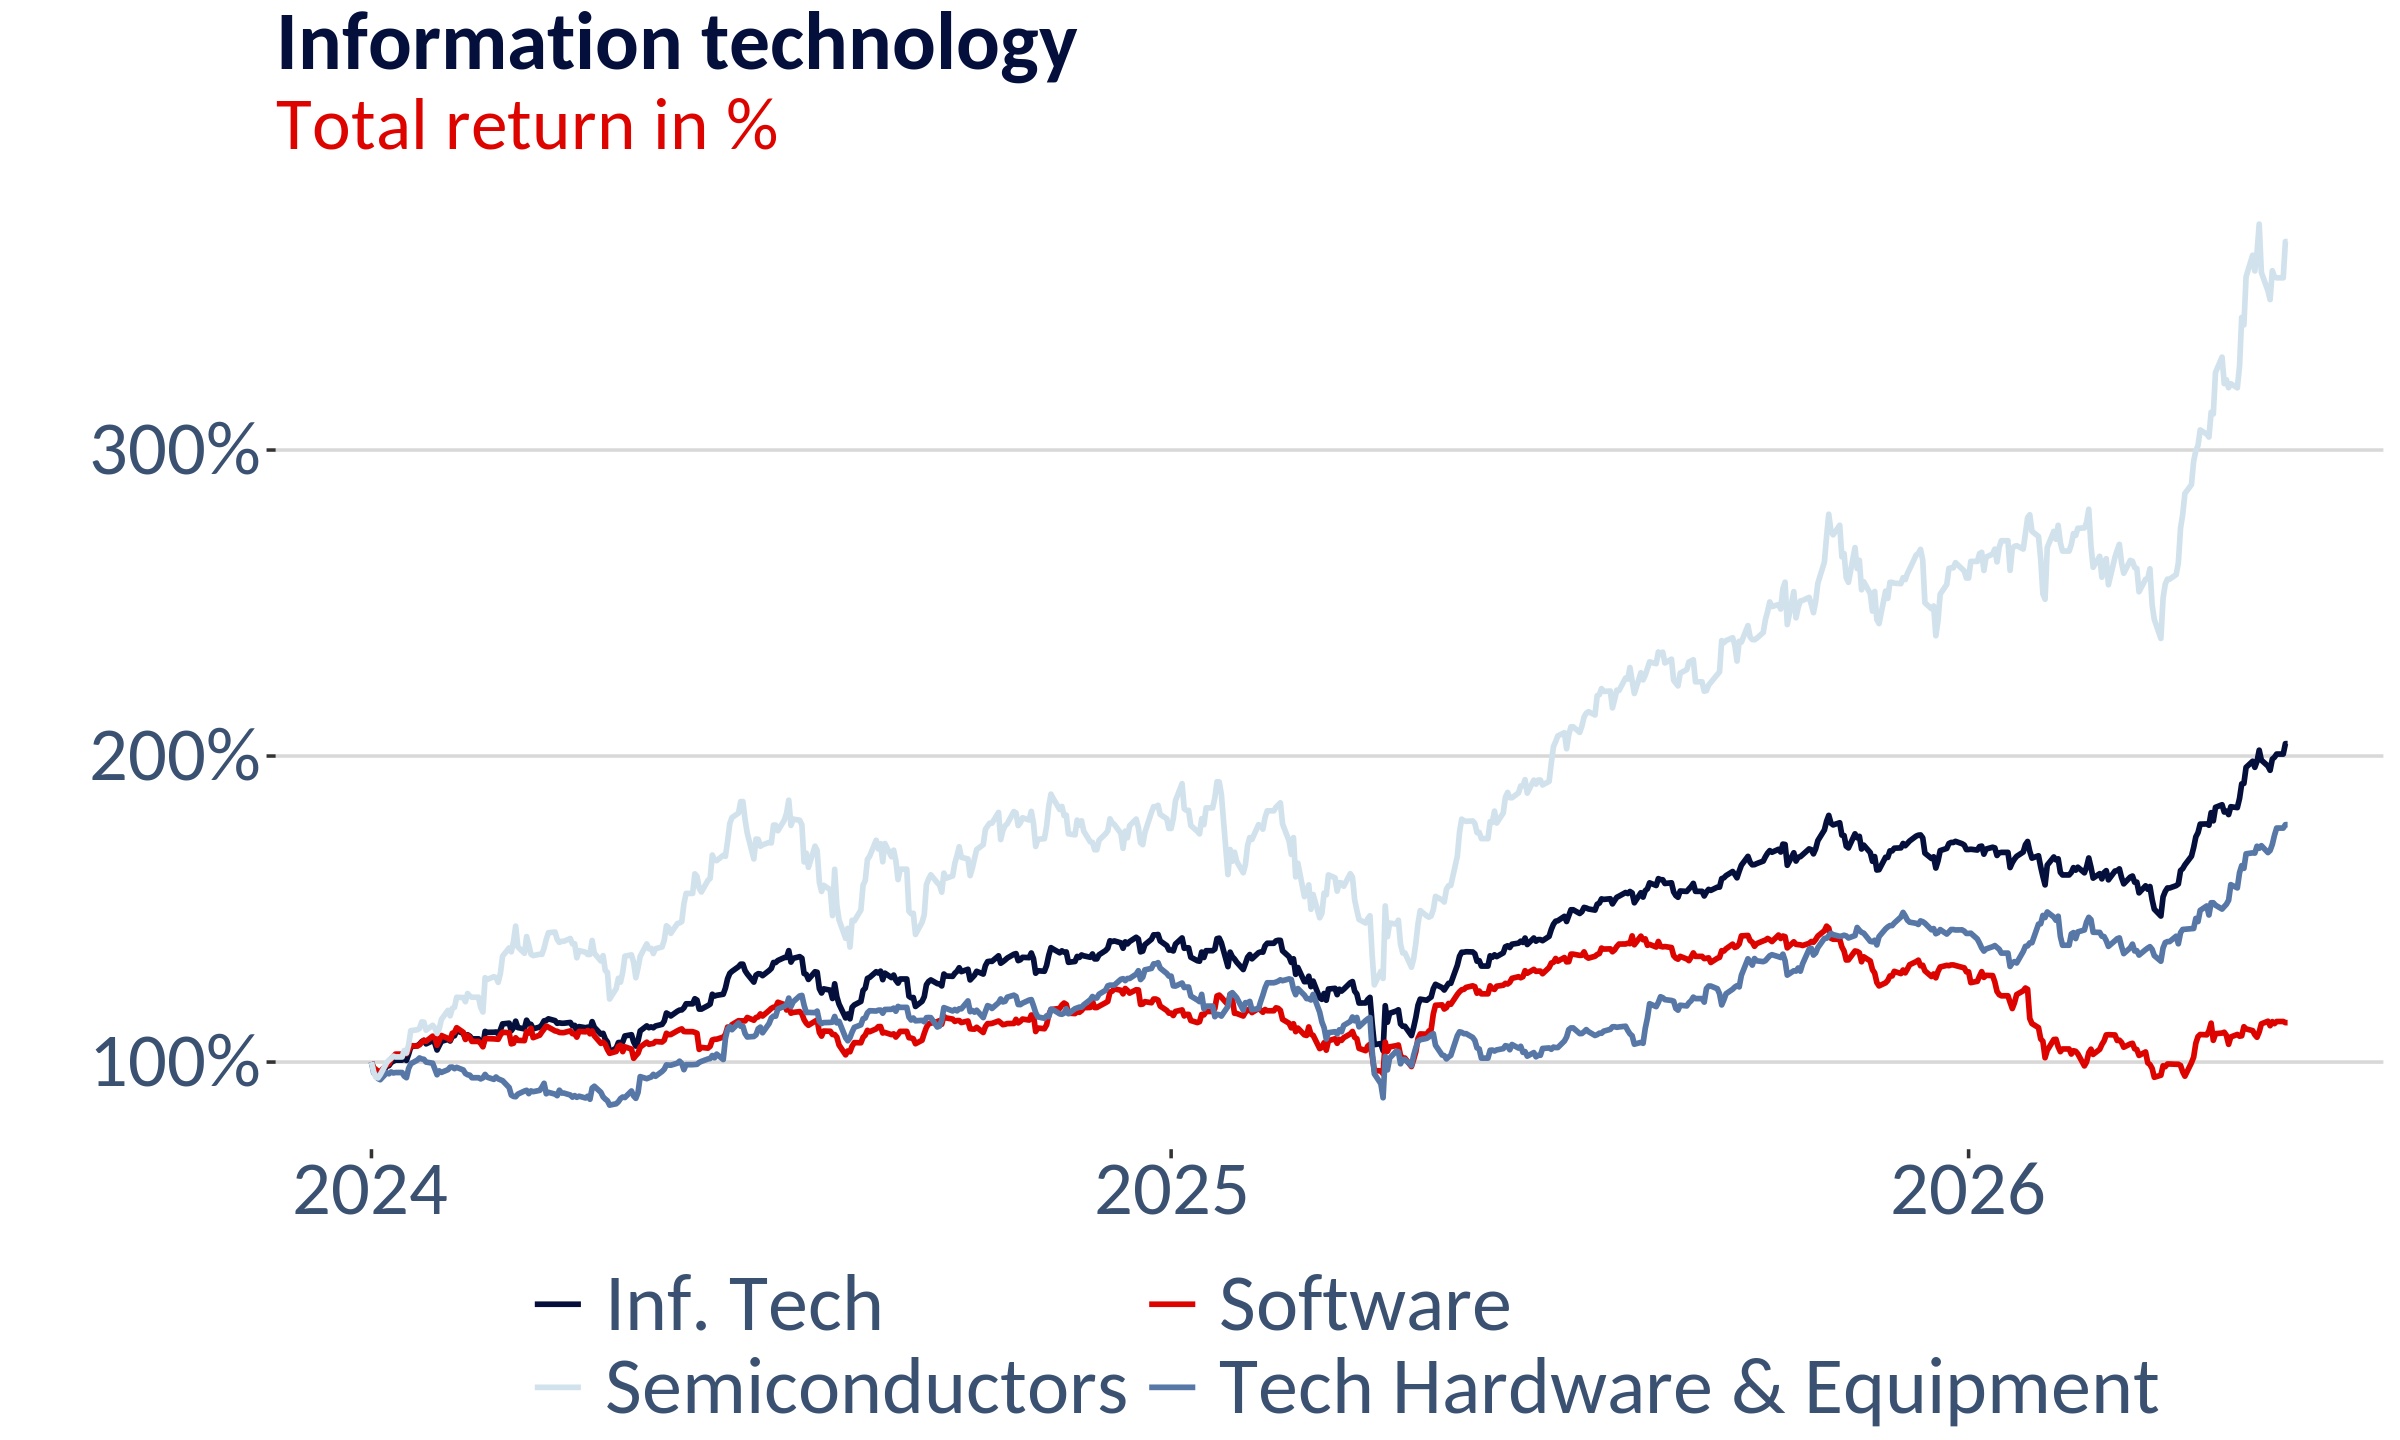
Consequently, what we have witnessed so far is primarily a correction of valuation multiples. While software firms in the S&P 500 are now trading at Price/Earnings multiples of around 25x (still not exactly low), they are down almost 30% from levels observed in 2025. Instead, the Tech Hardware & Equipment Sector, which includes unexpected AI beneficiaries such as SanDisk (+4000% since August 2025) and, of course, the semiconductors subsector, led by Nvidia, has driven technology's outperformance.
These rapid changes in market leadership have also had a pronounced impact on the relative performance of the most popular style factors. Value, which skews towards businesses with low valuation multiples, which are typically capital-intensive companies with low profit margins and sluggish top-line growth, benefited from massive rallies in semiconductor firms such as Micron and Intel (previously almost left for dead), as well as a boom in usually boring telecommunications operators like Cisco (whose P/E ran from 14x in mid-2025 to 25x). At the moment, the MSCI USA Value Index has a 44% weight in semiconductors (dominated by lower-quality names such as Micron and Intel) and technology hardware, and only under 2% in software, even smaller than its 2.6% exposure to oil and gas. By comparison, the MSCI USA Quality index holds only 28% in the two industries (geared towards Nvidia) and has an 8% allocation in software through big, stable names like Apple and Microsoft.
The recent outperformance of traditionally unloved semiconductor and technology hardware and equipment names has also triggered one of those rare moments where Value and Momentum are similarly positioned (the MSCI USA Momentum index now has a 43.7% weight in semiconductors and technology hardware and likewise skews towards the names with the most volatile sales and earnings, which delivered the highest performance this year). At the same time, the change in style leadership has triggered a wave of articles on the "death" of quality investing and comments on its flaws.
We would argue that rather than signaling a fundamental problem with the selection of companies based on traditional quality criteria, the underperformance of the factor has highlighted two dilemmas of style factor investing and, in fact, of active single stock selection in general. Academic literature has generated a wealth of risk- or non-risk-based explanations for the long-term performance and supposed outperformance of certain characteristics, such as Value and Momentum. This can sometimes give the impression that these are diversified portfolios based on stock-specific characteristics that are capable of achieving risk-adjusted outperformance relatively consistently. Unfortunately, this may overstate the causal relationship between factor-specific characteristics and returns. Some characteristics such as financial leverage and cyclicality undoubtedly increase or decrease the risk of a stock, but the link to future returns is often rather coincidental.
In other words, Value has made a comeback in recent months, and Quality has fallen out of favour. However, is this truly related to a long-term return generating power of the Value factor (e.g. distressed companies being too cheap because investors are uncomfortable with holding them) or is it just a function of a new technology and two wars incidentally benefiting businesses that for the longest time were probably cheap for a reason and are now generating tremendous returns, not because they had low valuation multiples but because their cash flows are exploding? It also shows why it is so challenging for active managers to outperform the market. There is hardly a reliable recipe for it.
The break in long-standing trends could allow stock-pickers to shine
This brings us to another timely question: Strong recent performance, particularly in the hottest sectors of the market, has unsurprisingly triggered the usual concerns about irrational exuberance and excessive valuation levels, including comparisons to 1997 or 1999.
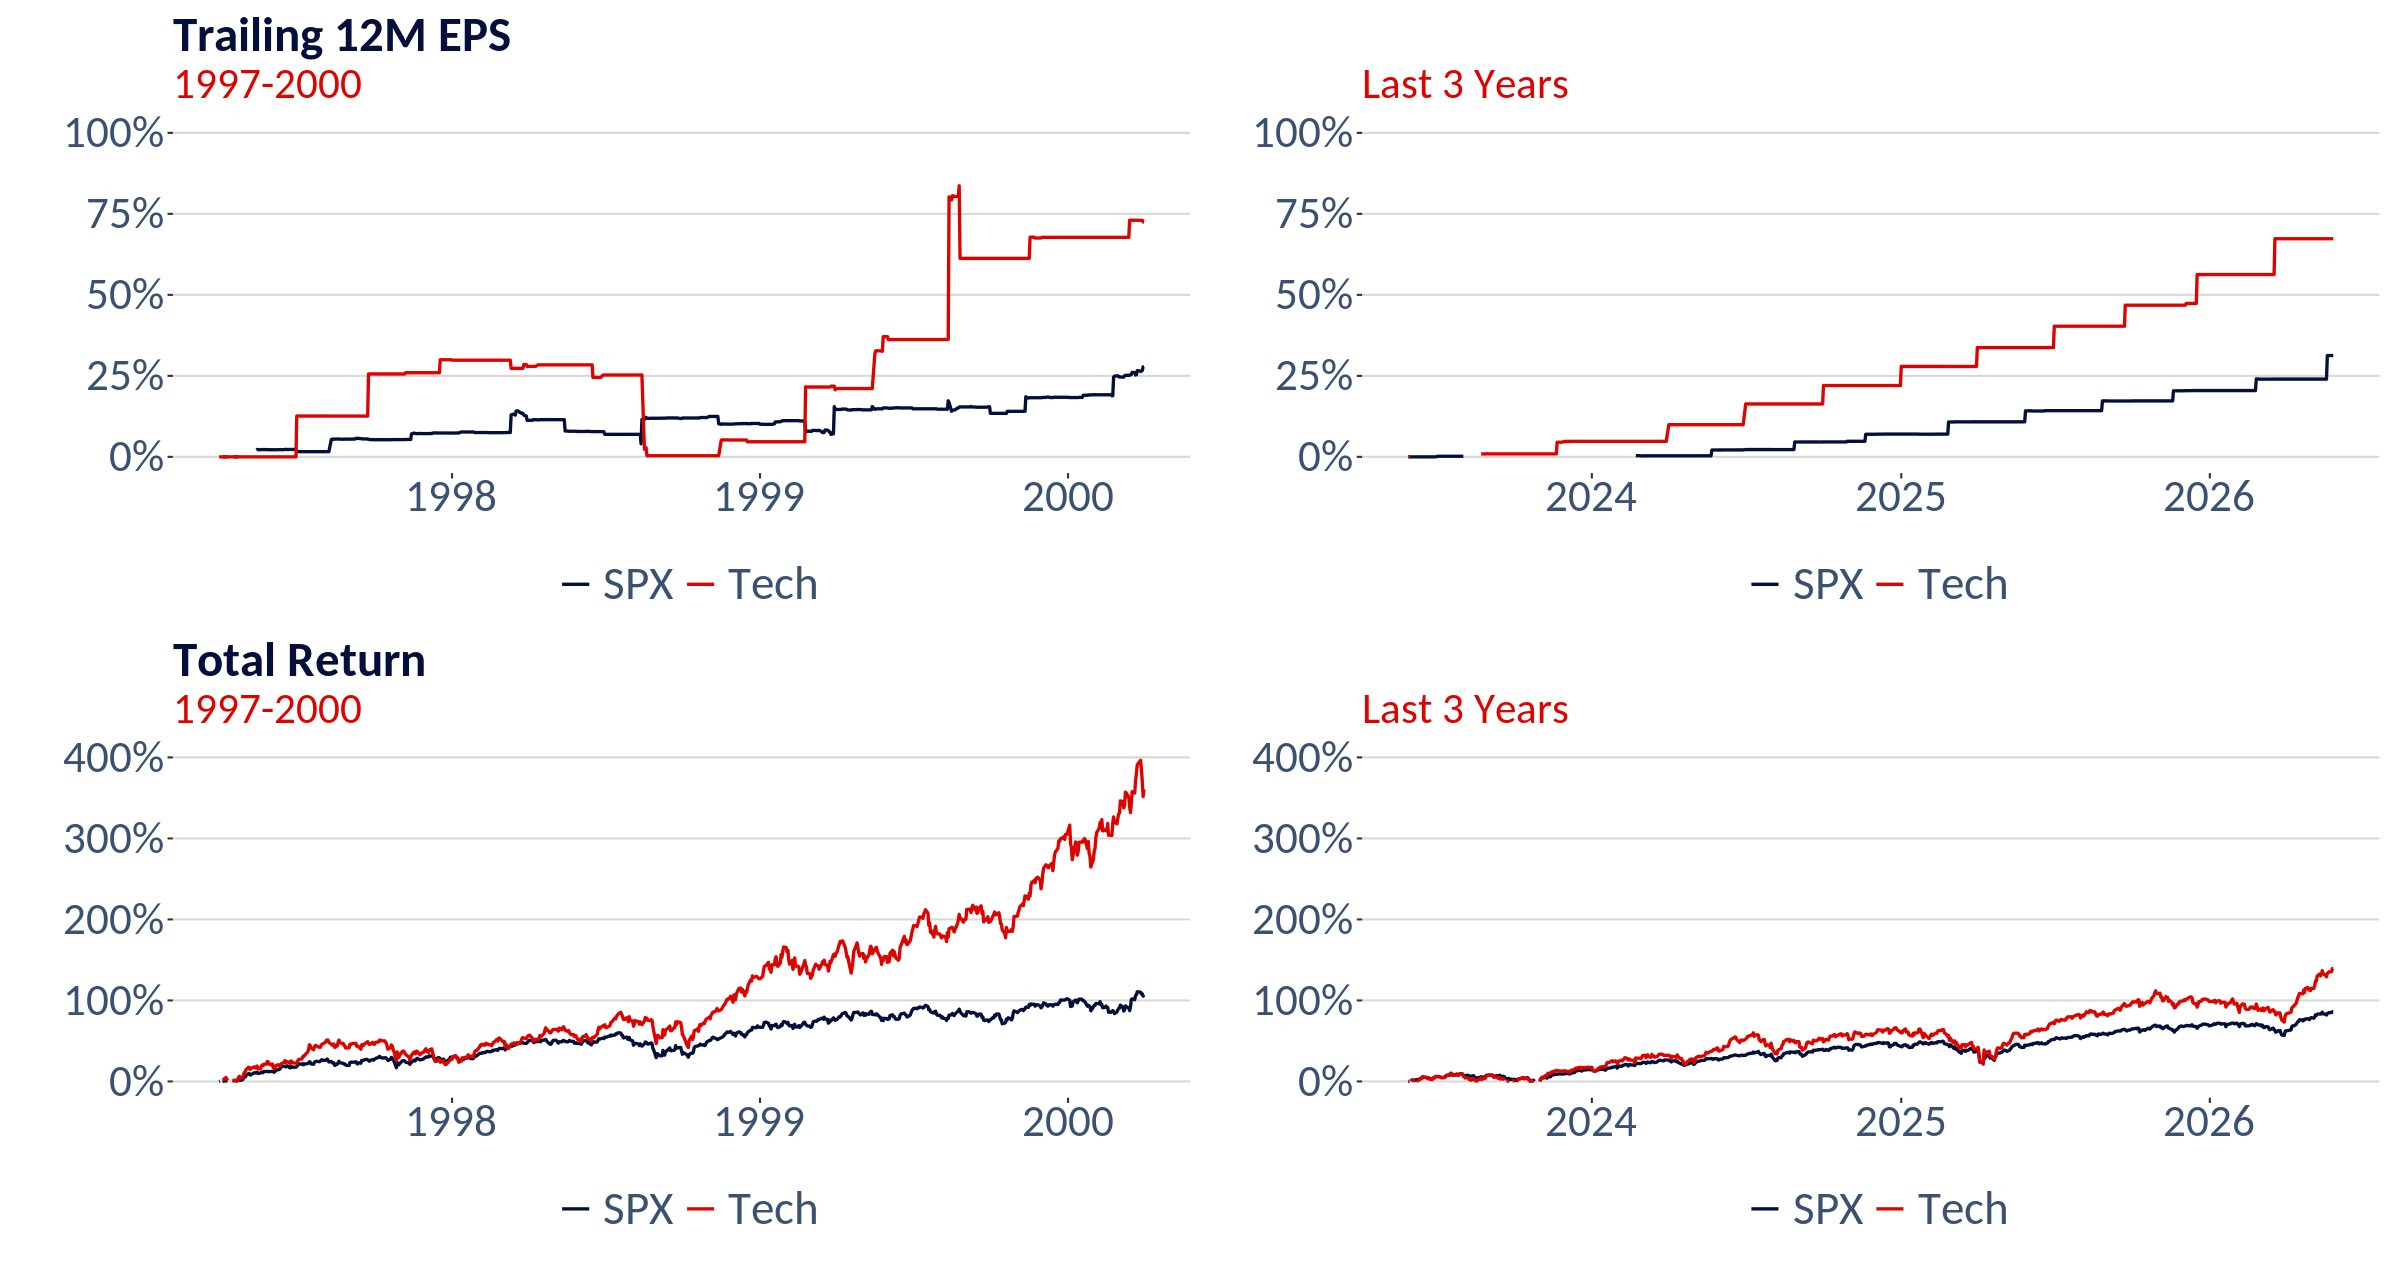
In the 36 months before the Dot-com bubble burst, US technology stocks rose 400% while earnings increased by 75%. The aggregate valuation multiples for tech stocks rose from 25x to 70x. Oddly enough, the cumulative profit growth of 75% in the run-up to the dot-com bubble bursting mirrors the similarly rapid profit growth seen in the same GICS sector over the past three years, although this time there has been significantly less volatility. However, price movements have been much more modest this time, with a 150% total return for the MSCI USA Technology index that has inflated valuation multiples by "only" 50% between 2023 and 2024. They have been broadly stable since then and will arguably deflate relatively quickly if the likes of Nvidia manage to get anywhere close to analysts' predictions of 100% EPS growth in 2026 and another 40% in 2027.
So, if we are in bubble territory, it is less a valuation bubble and more an earnings bubble. Does such a thing exist? In fact, circular agreements between suppliers (e.g. Microsoft) and their customers (e.g. OpenAI) can, in principle, lead to a situation where the earnings of an entire ecosystem are unsustainably inflated; but they remain less common and smaller in scale than during the dot-com boom.
The scale of the wealth currently being generated by those benefiting from the AI revolution is unprecedented, and the impact of this technology on all sectors is arguably far greater and more disruptive than that of the internet in the late 1990s and early 2000s, when it was still a niche pursuit for an interested segment of the global population with, as yet, limited applications. For stock pickers, this creates a challenging environment. Assigning an even higher weight to highflyers like Nvidia than the benchmark index (8% in the S&P 500) is often hard to defend, and popular institutional strategies such as buying stable compounders have underperformed. On the other hand, growing market breadth and bursts of outperformance in less conventional (value) plays in telecommunications and oil and gas probably benefited active managers that often seek to swim a bit against the tide.
We are, therefore, looking forward to the 2026 edition of the active-passive barometer. At least, a lack of dispersion and the never-ending outperformance of a few Mag 7 stocks can no longer serve as scapegoats.


